
Finalizing and Reflecting on the Research Process
A discussion of the finalization of my research process, my results and conclusions, a reflection throughout the inquiry process, and the implications of my research.
Results and Discussion
After completing the film analysis phase of my research, I quantified and analyzed the data yielded from the trials. I chose to display this data in the following two ways.
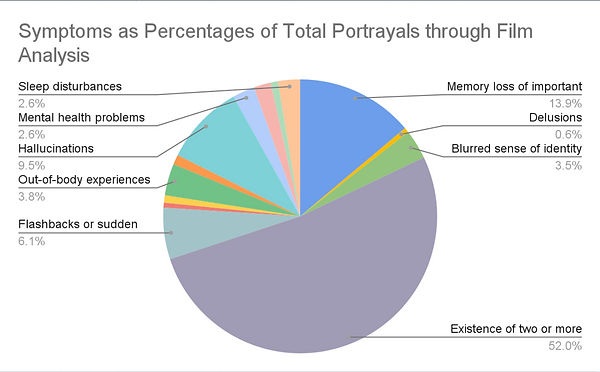
This first chart displays the portrayals of Dissociative Identity Disorder by symptom as percentages of the total portrayals across all films in my study.
The most noticeable feature of the graph is the stark amount of purple at the bottom, representing the existence of two or more distinct identities at 52.0% of all portrayals.
The second highest portrayal was memory loss at 13.9%, seen in blue at the top of the chart.
Some symptoms, such as delusions, were depicted as little as 0.6% of all symptoms shown.
Figure I: Percentage of each symptom in relation to total symptoms portrayed across all films.
The second chart illustrates the symptomatic portrayals by decade as percentages. Within each decade is the data from the two selected films visualized as percentages of the total portrayals.
Again the amount of purple on the graph, representing the existence of two or more distinct identities, is significantly larger than that of any others.
The only exception to this pattern would be the 1990s, in which the portrayal of the existence of two or more distinct identities was comparable to that of a blurred sense of identity.
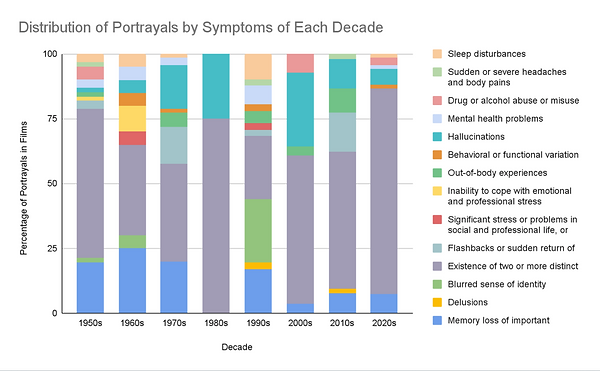
Figure II: Percentage of each symptom in relation to total symptoms portrayed across films by decade.
Having found and displayed the data from my film analysis, I set out to draw comparisons between cinematic portrayals and clinical knowledge. In order to do so, I examined case studies originating from the same decade as the films. The symptoms between the two case studies and two films from each decade were then compared to yield an approximate percentage accuracy.

This graph is a representation of the accuracy of the film portrayals analyzed. The black trend line illustrates the increase in accuracy over time from about 25 to about 60%.
In the 1950s, the cinematic portrayals were approximately 27% accurate to that of case study findings. However, in the 2020s, that number increased to 57%.
There is one outlier in this data, that being the 1990s at 30%. This disparity is likely due to the fact that the case studies only listed a total of four symptoms, meaning that with how many symptoms were shown in the film, the accuracy was bound to be lower.
Figure III: Percentage accuracy of symptoms portrayed in films in relation to case studies over time.
My original hypothesis, that the existence of multiple distinct identities would be portrayed disproportionately more than other symptoms, was directly supported by my data. Figures I and II demonstrate the majority of portrayals across all films. In relation to my secondary hypothesis, that films would get more accurate over time, the data displayed in Figure III directly supports it. The trend line increasing through the center of the graph demonstrates the increase in accuracy of symptom portrayals over time.
While both my primary and secondary hypotheses were supported by my data, my work wasn't without its limitations. The first limitation was the potential for human bias during film trials and calculations, which I tried to limit by randomizing the order of films and completing each calculation viewed above twice. My second limitation was the selection of alternate films. Two of my original film selections The Hours (2002) and The Mummy (2017), after film analysis were found to not depict Dissociative Identity Disorder. In replacement, I went back and chose the third highest grossing film from those two decades for analysis. My final limitation was the constraint of resources and time. Given that I am still a high school student, the scope of my research was limited, only allowing my to access certain resources. This being primarily the lack of availability of symptom lists from decades prior to 2020, which I chose to substitute with case studies from each decade.
Conclusions and Reflection
Conclusions
Returning to the original exigence of my project, no work in the scholarly conversation has been done to analyze films depicting DID with a relation to both time and comparison. My research directly fills this gap, by considering the portrayals of DID in 16 films from 8 decades. Of course, my study only draws conclusions based on the resources available. Researchers in the field could absolutely replicate my work, or fabricate similar methodology, to find concrete proof of my hypothesis.
That being said, my work still has a number of broader implications, beginning with further research as aforementioned. The next is creating a separation of fact and narrative in the depictions of mental health conditions in film. Audiences, without prior knowledge of or experience with DID, could easily confuse it with other conditions or accept fiction as reality when viewing films. The next implication is the increase of understanding of DID by film viewers. My study goes to represent the truth of DID, which may not always be depicted in films. Finally, my study could inspire a change in the standards of the film industry, that being a collaboration between filmmakers and psychiatrists. This would act to increase the accuracy of the films, but also to to justice to those with mental health conditions who are being misrepresented to the greater public.
Reflection
Think back to the initial curiosity that sparked your inquiry. What other curiosities do you have and how has this process prepared you to explore them?
After viewing the films, I noticed that 11 of the 16 films depicted the character with DID as having a criminal record, many of those being serious crimes such as kidnapping or murder. Knowing this, I would be curious to explore the relationship between DID and criminal behavior in actual patients as compared to film. Having completing this study already, I would be able to easily find sources and films to analyze, as well as a trusted methodology that could be adjusted to fit this new inquiry.
If you could revisit the research process, what would you do differently and why?
Given the opportunity to revisit the research process, I would code the films for all symptoms portrayed, not only the symptoms related to DID. For example, in the film Split (2016), the main character with DID was diagnosed with OCD. While it could be considered a mental health problem, it is not one related to DID, so I was unable to log it per my methodology. In revisiting the process, I would note all symptoms to determine whether or not there was a false relation of symptoms that are not associated with DID. This would be done to expand the scope of my work, rather than focusing on a certain grouping of symptoms.
What was the most important research skill you developed as a result of the research process, and how might you apply it to your future endeavors.
The most important research skill I gained from this process was adaptability. This was because I had to make a lot of unexpected changes to my methodology during the research process. Some of the changes included alternative film selections, the use of case studies, and adjusting calculations. This skill can be brought forward as I select a college in the coming weeks. My whole life I have expected to go to obtain my bachelor's degree in person, but due to personal goals and needs, that may be shifting. This research process has not only allowed me to be adaptable to change, but accepting of it as well, and that is a skill I can take forward in many areas of my life.